Matthias Rohm, Patricia Moser, Christian Fuczik
Institut f. Hanfanalytik / Christian Fuczik – Chemisches Labor GmbH, Vienna, Austria
Contact: info@hanfanalytik.at / www.hanfanalytik.at
Following the partial legalization of cannabis in Germany, interest in the actual potency of cannabis flowers has increased significantly. While THC levels are often displayed on packaging, shared on social media, or communicated through informal sources, there is limited data on the actual composition of the flowers used by consumers. Importantly, THC content is a key quality and safety parameter, as it substantially influences both the pharmacological effects and the risk profile of cannabis products.
With more than 70,000 visitors and several hundred exhibitors, Mary Jane Berlin 2026 brings together consumers, producers, retailers, and professionals from across the cannabis industry. This event provides a unique opportunity to collect a wide range of real consumer samples and investigate their CBD and THC contents. [1]
The analytical determination of tetrahydrocannabinol (THC) and cannabidiol (CBD) is essential for the quality assessment of cannabis products. Despite increasing market regulation, there are significant variations among cultivars, production batches, and countries of origin. Previous investigations conducted in our laboratory have shown that actual THC concentrations often differ from the values declared on product labels. Independent analyses play a crucial role in promoting transparency and providing consumers with accurate information.
During Mary Jane Berlin 2026, cannabis flower samples submitted by exhibition visitors were analyzed on-site using near-infrared (NIR) spectroscopy. [2] The goal of this cross-sectional analysis was to determine the THC and CBD concentrations in these submitted samples and to provide an overview of the actual potency of cannabis flowers available in the market. The results aim to enhance understanding of current market trends and to emphasize the importance of analytical quality control in the legal cannabis industry.
On-site analyses were conducted using a portable near-infrared spectrometer (NIR). The NIR method used is based on a chemometric prediction model developed and validated using an extensive reference database of chromatographically characterized cannabis samples. [3] The limit of quantification for all cannabinoids was set at 1%.
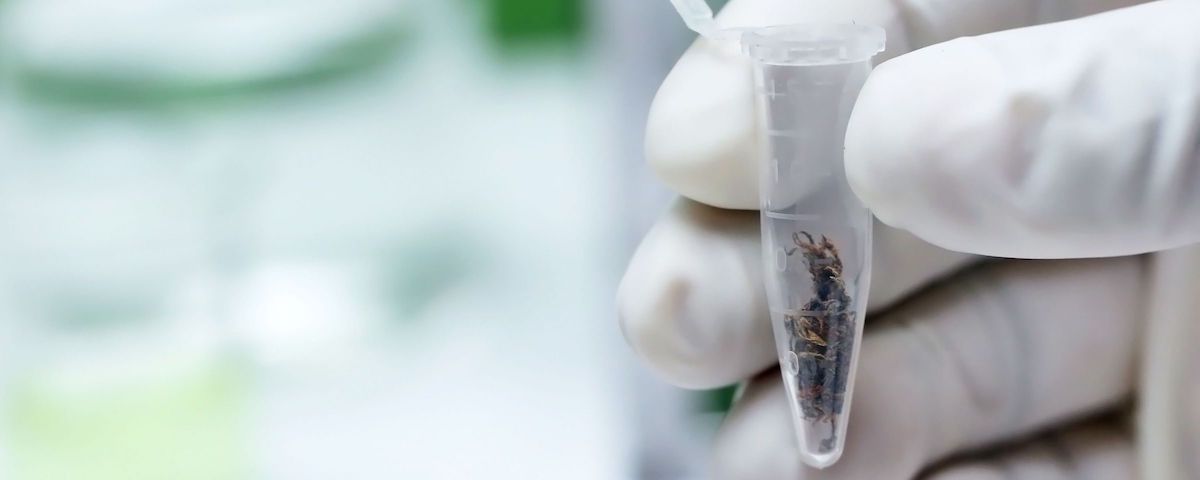
For each submitted cannabis flower sample, we first recorded the available information about the cultivar. Each sample was then photographed for documentation. To ensure sample homogeneity, the cannabis flowers were homogenized using a metal grinder. The homogenized material was transferred into an aluminum weighing dish and analyzed three times using NIR spectroscopy. The mean value of the three measurements was used for further evaluation.
Throughout the analytical process, the samples remained in the participants' possession. After the measurements were completed, participants had the opportunity to transfer the homogenized material into a transport bag provided for take-home use. This approach ensured that the samples were never taken into custody or stored by the investigators.
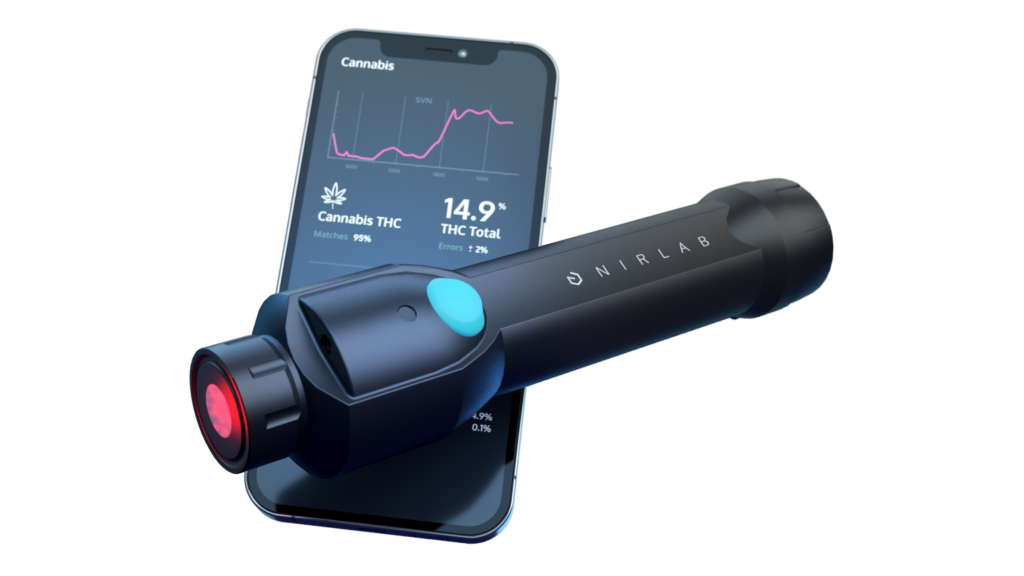
Fig. 1: NIRLab NIR Spectrometer
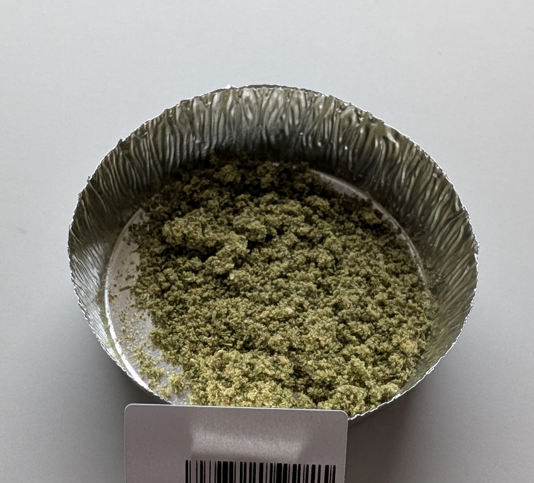
Fig. 2: Sample in aluminium weighing dish
The sample is based on voluntary sample submissions from trade fair visitors and is therefore not representative of the entire German cannabis market. The classification of strain names was based on information provided by the participants and was not verified analytically.
A total of 534 samples were submitted for analysis. These were categorized as:
The CBD-dominant samples showed a median concentration of 10.9%, with values ranging from 4.5% to 16.6% CBD. The concentrations of CBD and THC in the hybrid samples are presented in Fig. 3.
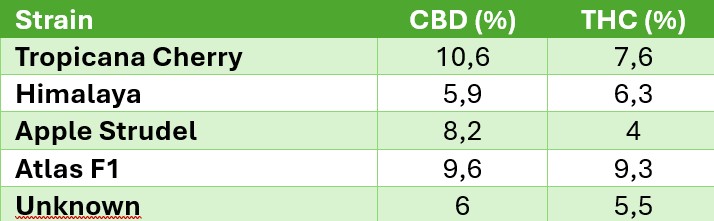
Fig. 3: Cannabinoid levels of CBD–THC hybrid samples
Meanwhile, the THC-dominant samples demonstrated a median THC concentration of 17.4%, with values ranging from 5.9% to 25.7% THC. Therefore, these samples submitted by visitors fall within the range of modern, high-potency cannabis flowers that are increasingly observed across Europe. [4]
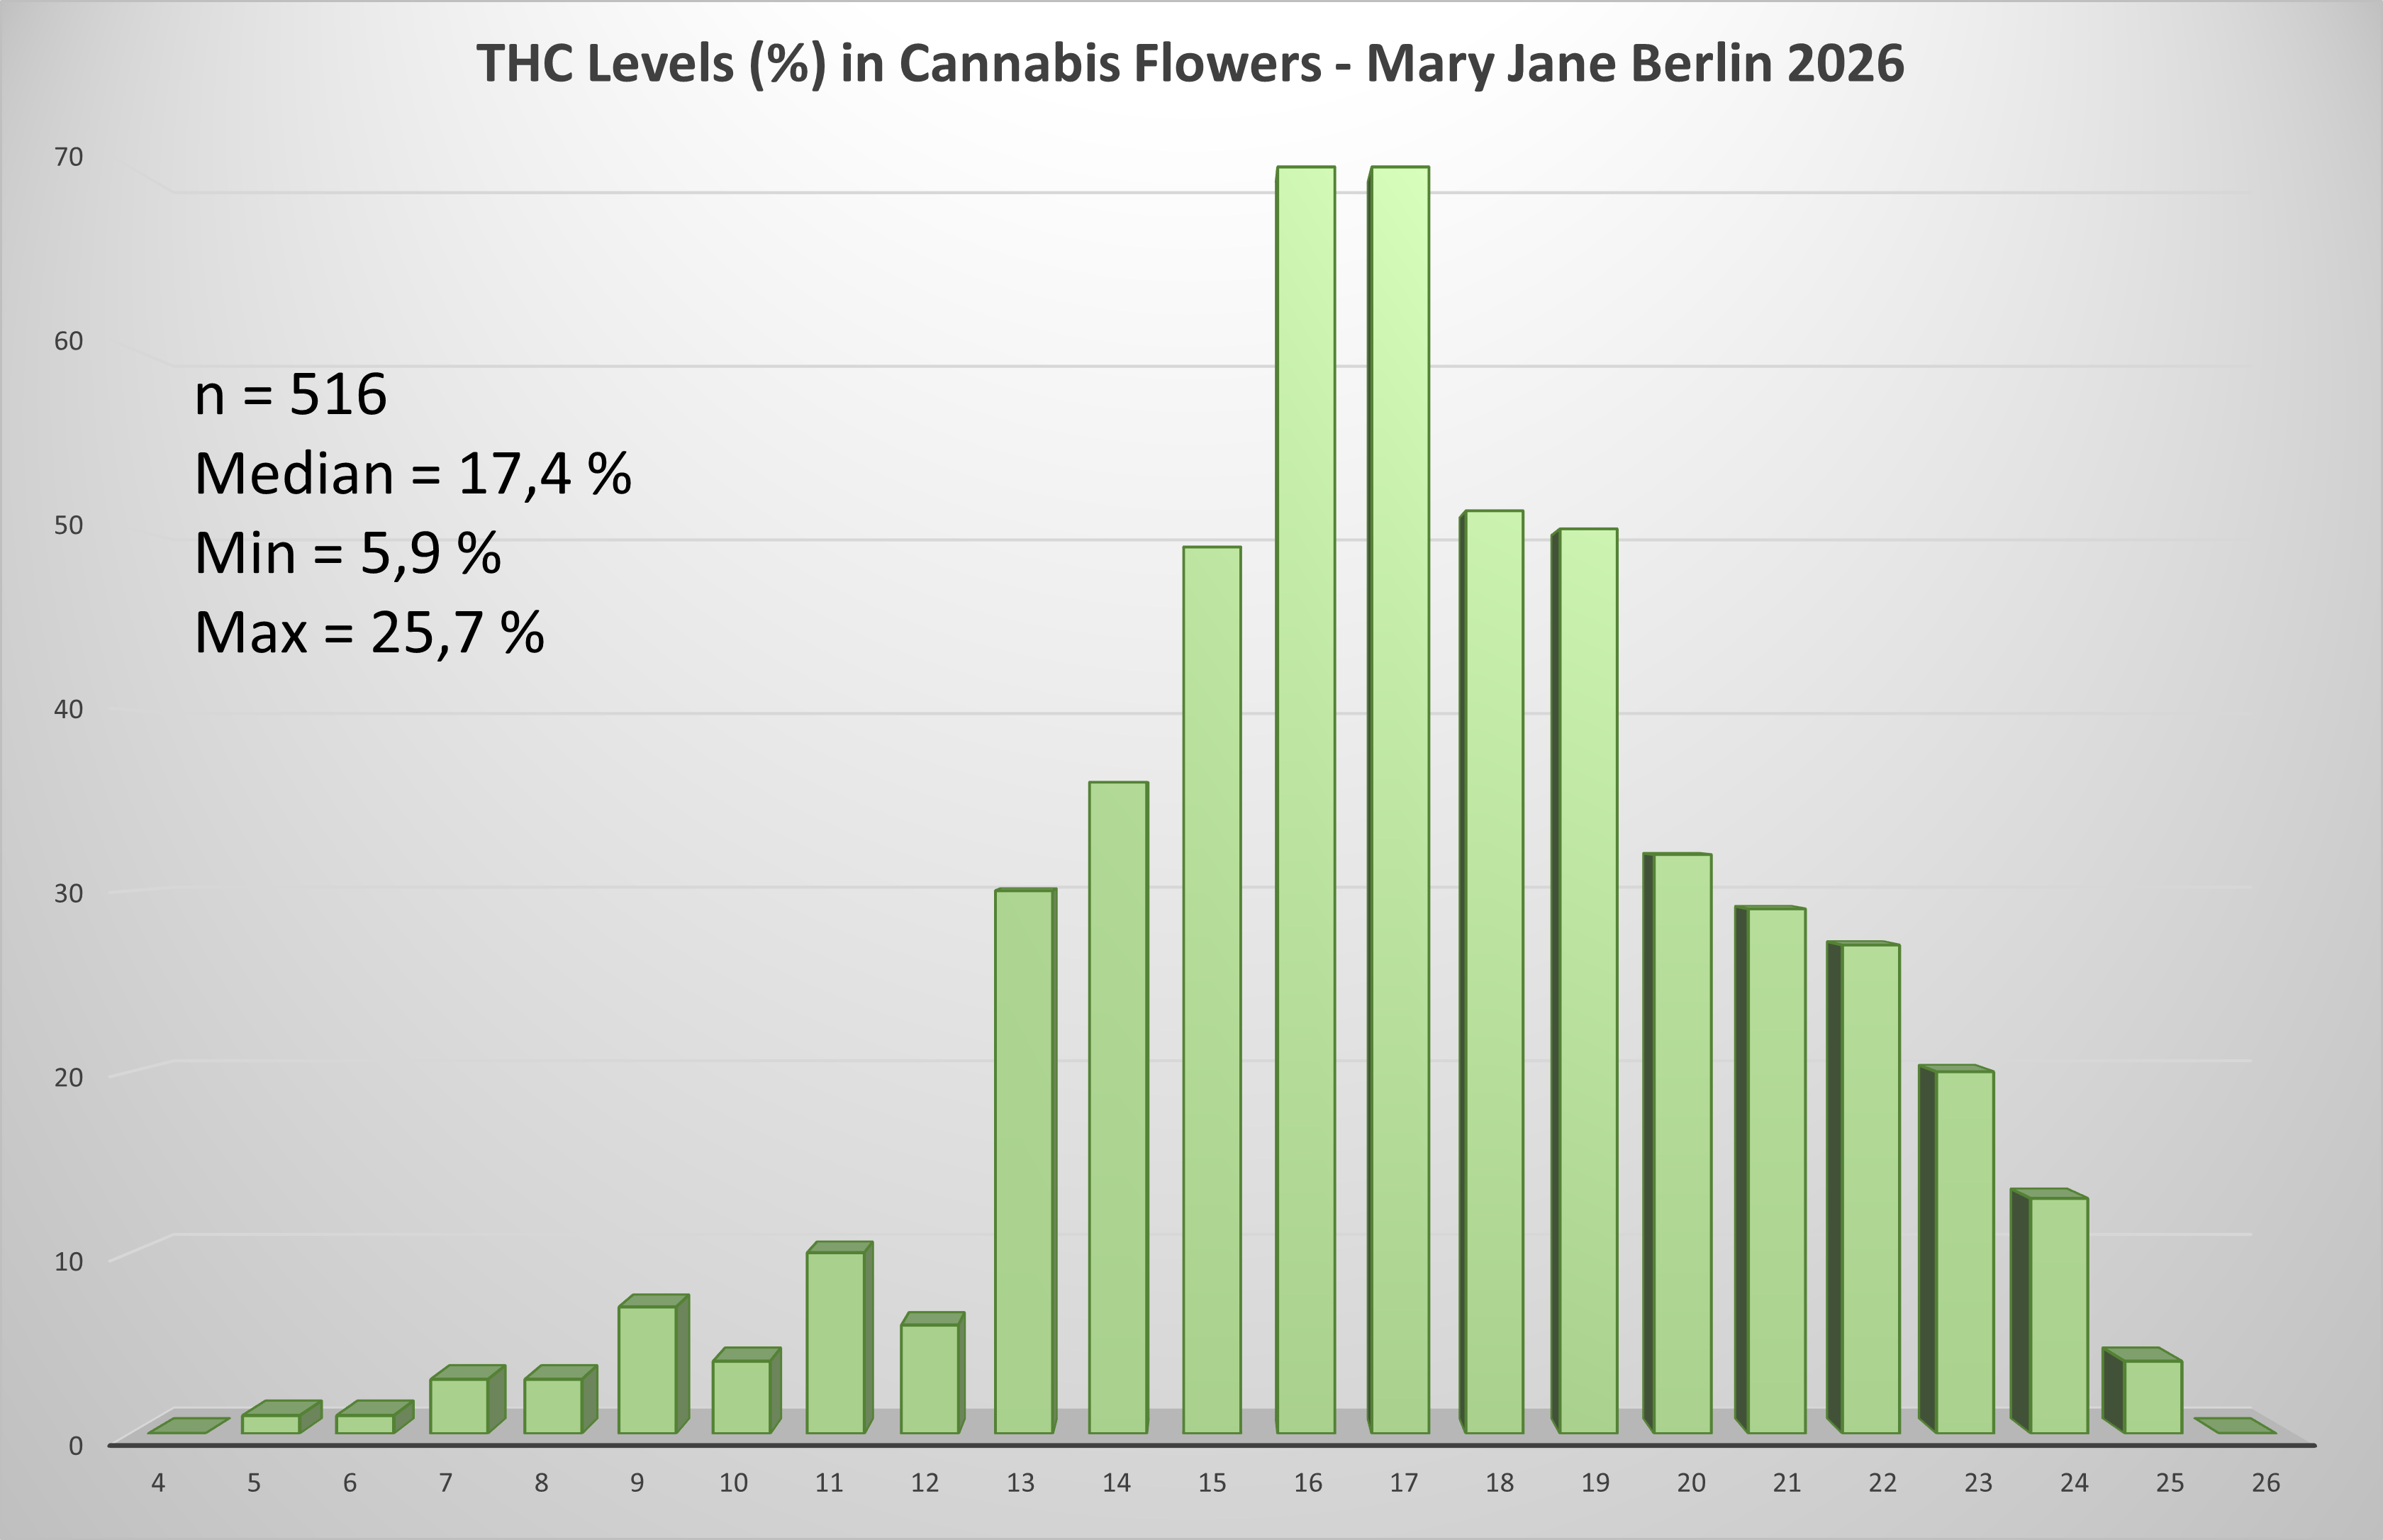
Fig. 4: Distribution of THC concentrations in THC-dominant samples
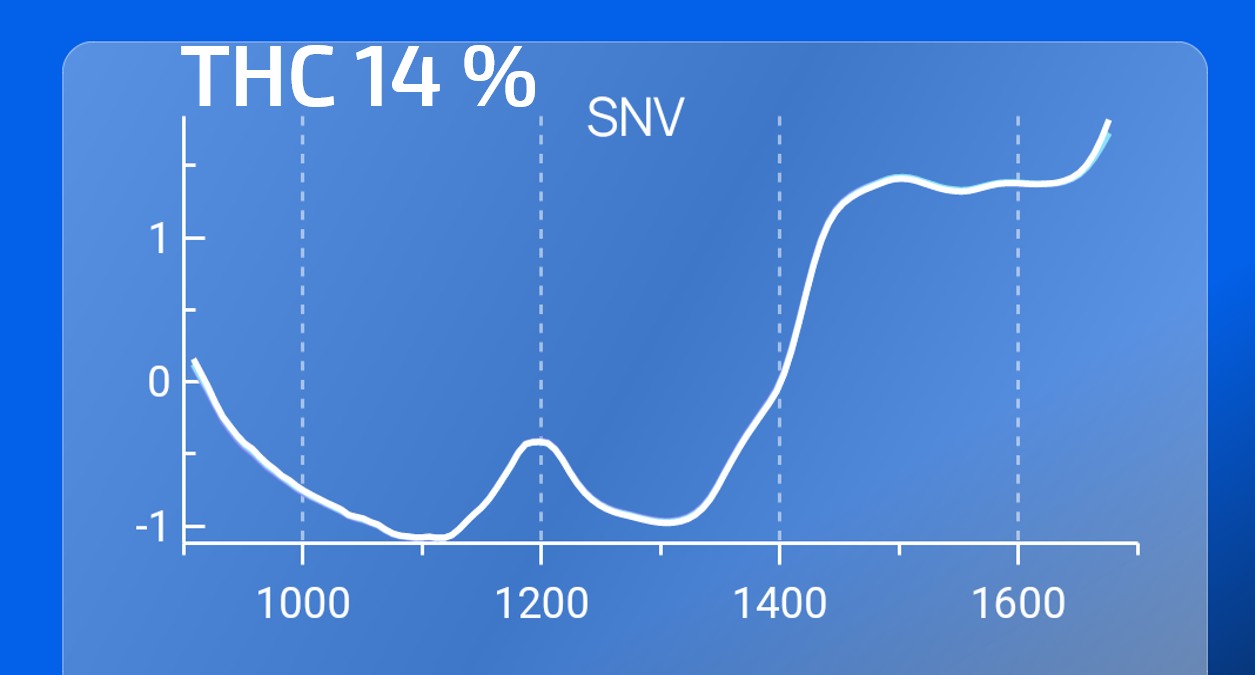
Fig. 5: NIR signature of a THC-dominant cannabis flower sample following Standard Normal Variate (SNV) pre-processing. The cannabinoid contents are determined from the characteristic spectral features using a validated chemometric prediction model.
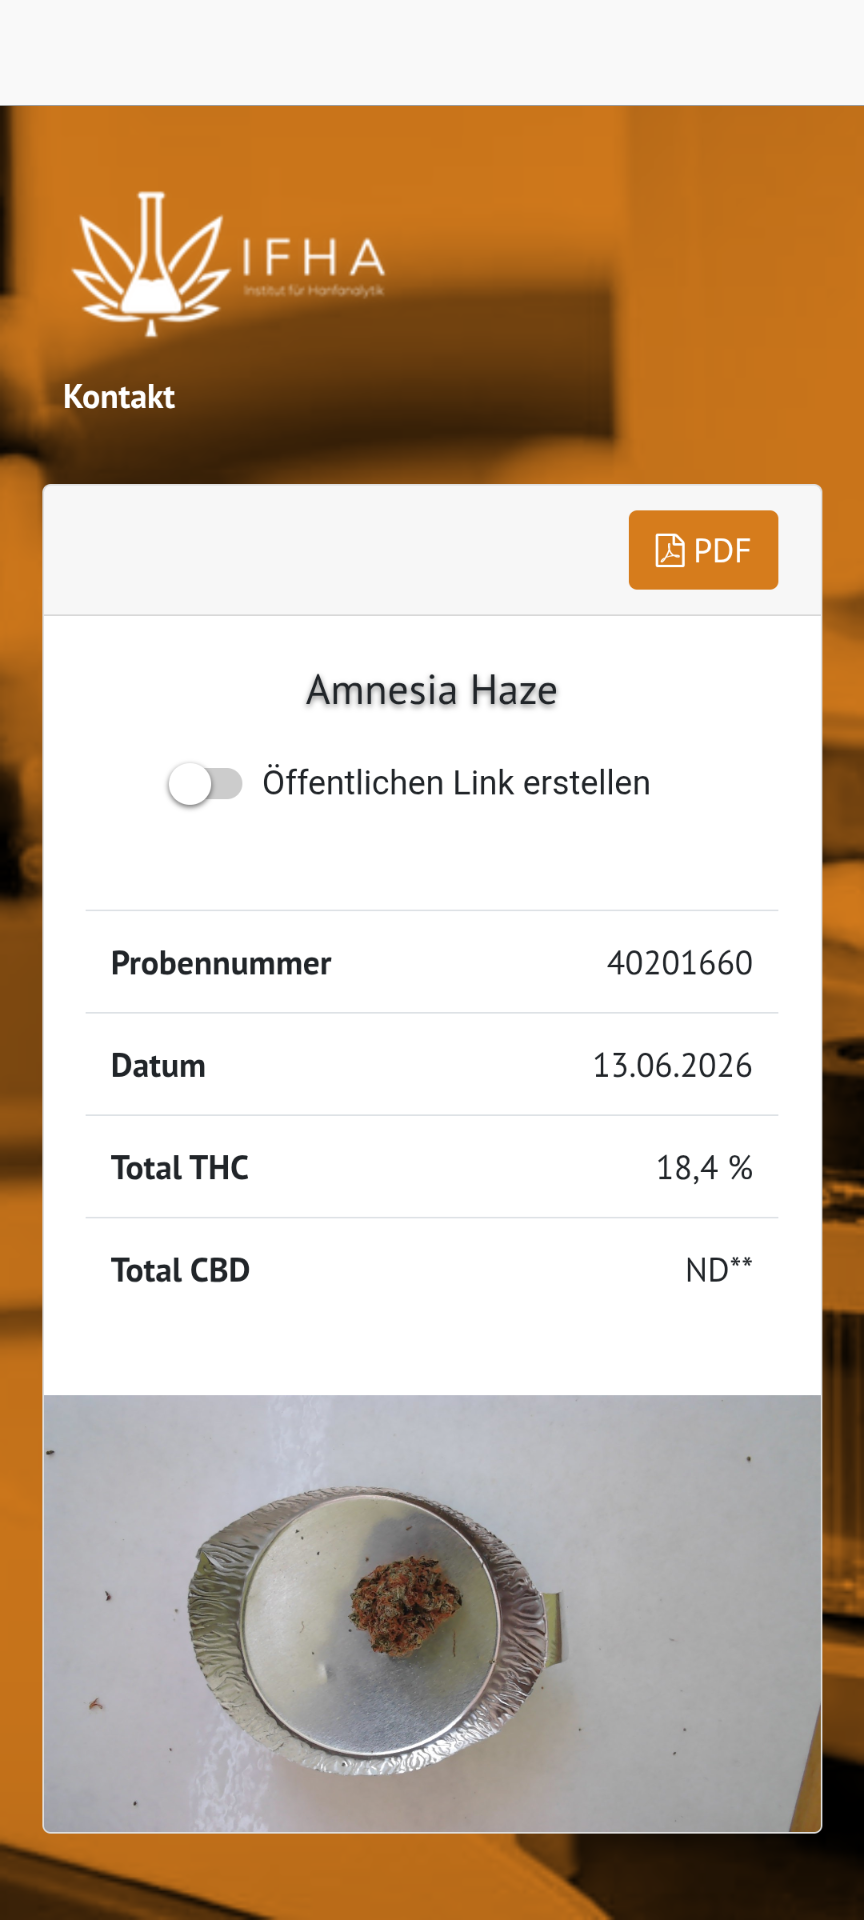
Fig. 6: Example of a participant's online results page
Recent European studies have indicated that the average THC concentrations in herbal cannabis range from approximately 7% to 13%. However, there has been a noticeable trend of increasing potency over the years. In particular, some selectively bred indoor cultivars now frequently achieve THC concentrations exceeding 20%. [5]
The median THC concentration of 17.4% identified in this study is higher than the historical European averages and is consistent with the continuing trend toward more potent cannabis products. [6] Importantly, none of the samples analyzed had THC concentrations above 30%, which sets them apart from concentrates or specially bred ultra-high-potency strains occasionally available on the market.
The results indicate that the cannabis flowers submitted by visitors to the exhibition align largely with the current quality and potency standards of the legal and semi-regulated European cannabis market. However, it is important to note that, because participation was voluntary and the data were collected at a specialized trade fair, the sample cannot be considered representative of the entire German cannabis market. Nonetheless, this information offers valuable insight into the actual THC concentrations of cannabis flowers consumed in Germany in 2026.
We would like to thank Hybrid Supreme Activated Carbon Filter for providing space at their exhibition booth and for their support and warm hospitality during Mary Jane Berlin 2026.